Summary
The city of Chicago faces a crucial public health crisis to reduce total cases of West Nile Virus (WNV) as well as vector mosquitoes. Controlling the mosquito population is the first hurdle to preventing West Nile Virus seen in the population and spread of mosquito borne diseases. Mosquito control is challenging due to a constantly moving target, while also trying to maximize value by wisely spending public funds.
Our objective was to predict when and where the worst outbreak could occur and what indicators could be used to gauge when action needed to be taken. If done successfully, a comprehensive spray plan can be developed to prevent West Nile outbreaks across the city.
Dataset
Our data contained collection data per trap for 2007, 2009, 2011, and 2013. Each observation told us how many particular vector mosquitoes were collected on a particular day by location and whether it tested positive for West Nile. Since there are more negative observations than positive cases, we were dealing with an imbalanced dataset.
This type of data presented numerous challenges since variations across years, location, and seasonality created a multi-tiered problem to try and unpack.
The image below demostrates the difficulty in grouping postive cases of West Nile into discernable groups. Positive cases can still seem to follow certain groups by year and time of year, ability to make useable clusters quickly falls apart once we start factoring in species and trap as well.

To make the problem more approachable, we focused on exploring certain features to determine their influence on positive West Nile cases.
Dependency on Seasonal Variation
Seasonal flucuations in mosquito population was very apparent within the dataset as we observed patterns across each year. This took us into two possibilities in, either:
A) building a weight system to adjust for seasonal changes or
B) to rely on calendar indicators such as month and day of the year.
In the end, using the calendar method provided enough detail within the model.
Species Type
Species type contributed strongly to predictions based on the population size of each type, with some species being more likely carriers of the virus. Fluctuation in time of year per species was an added level of complexity that held back how much we could rely on species as a predictor.
| Species | Rate of WNV |
|---|---|
| CULEX ERRATICUS | 0.000000 |
| CULEX PIPIENS | 0.088922 |
| CULEX PIPIENS/RESTUANS | 0.055135 |
| CULEX RESTUANS | 0.017883 |
| CULEX SALINARIUS | 0.000000 |
| CULEX TARSALIS | 0.000000 |
| CULEX TERRITANS | 0.000000 |
Culex Pipens had the highest rate of West Nile present across the entire dataset, but this still varied between seasons.
Location of Trap
There were certain locations that collected higher concentrations of mosquitos and thus had higher positive cases of West Nile Virus detected. However, this was not consistent across years and setting up categorical features per trap did not prove to be effective. Relying on the latitude and longitude did provide a baseline for proximity but improvements need to add for a more comprehensive spatial analysis.
To help visualize spatial relationships, a time-series animation was created to help determine how to consider trap proximity in the model. This allowed a narrative to form and influence how feature engineering would occur.
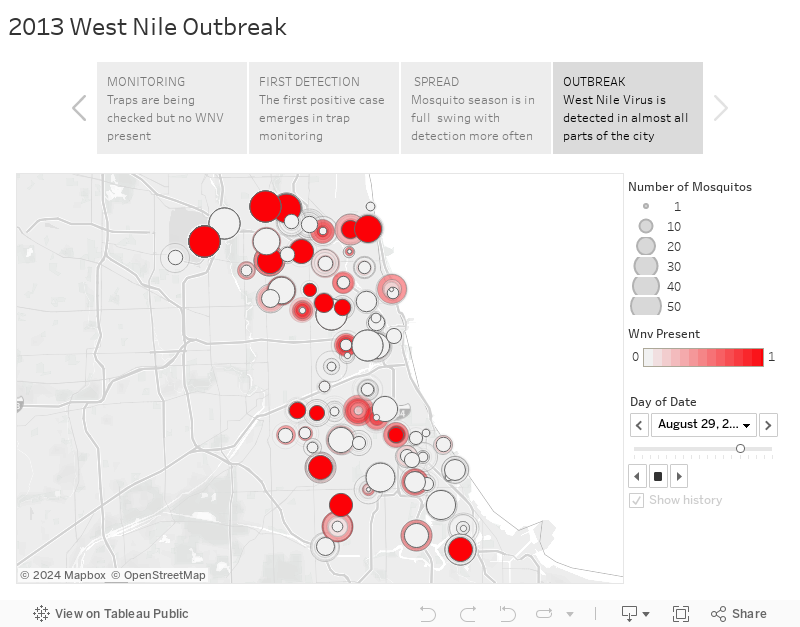
Spatial Analysis of Traps Proxmity to L-Train stop
After going through the initial set of data available to us, we noticed there was too much granularity to dummy each trap, but proximity was still relevant. Latitude and longitude for each trap provided some necessary detail but does not account for the true shape of Chicago and movement of people.
To account for this, traps were grouped by their proximity to it’s closest L-train stops and categorized by which line it belonged to (i.e. Blue Line, Red Line, etc).
This added a useable feature beyond geographical coordinates that ended up contributing positively in it’s test iterative to our models overall performance.
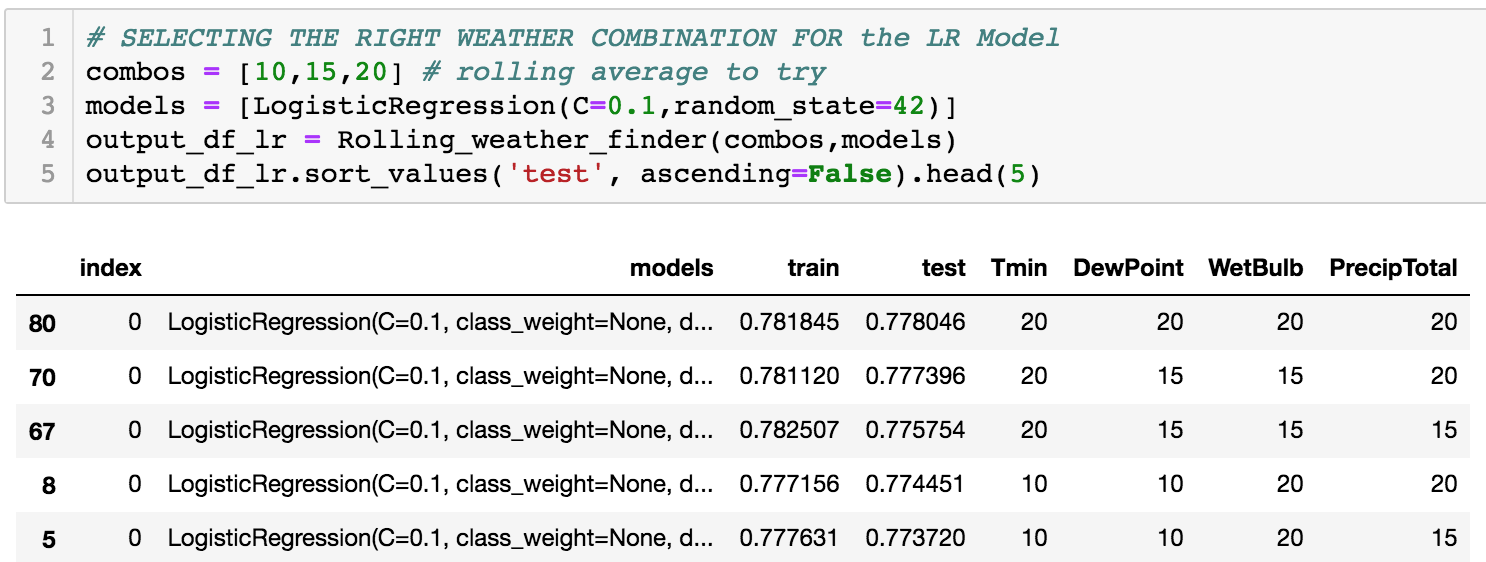
Multivariate Testing with Rolling Weather Data
Using the available weather data, it was imperative to use the most useful set of weather data and it does not necessarily line up on a day to day basis with positive cases. Mosquito population can be influenced by what the weather conditions were for the previous day or possibly the previous month.
In order to do this effectively, I built a function that would run through each possible combination of rolling average or totals for the relevant weather data to be used in the model. This way we could find whichever alignment of weather features gave us the strongest combination instead of just applying a one size fits all approach.
Models
Our approach started off by using a set of multiple different classification models and determining which would be best suited for our analysis. Since our metric was based on maximizing the ROC-AUC score, visualizing this graphically was beneficial and provided insight into model performance.
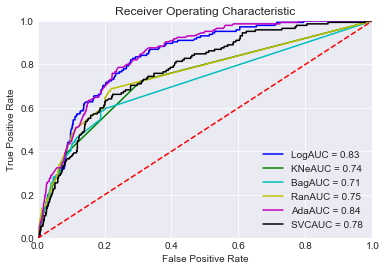
Our initial evaluation indicated ADABoost and Logistic Regression were the best out of the box models to use for our analysis.
Model of Choice: Logistic Regression
Logistic Regression ultimately allowed us to do feature engineering after the initial model and have it reflected well in the data. The strength of probabilities were on a lower range than other model types but overall produced a better roc-auc score.
Analyze Model
Analyzing the data came down to creating a list of probabilities per trap for our test set. Overall scoring was based on if our model could indicate a higher probability of West Nile occurrence with the holdout set being the entire years of data for 2008, 2010, and 2012.
Kaggle Score: 0.77
Our results put us in the 75th percentile of submissions in comparison to submitted results when the Kaggle competition was live.
Conclusion
Making accurate predictions is important but keeping your eyes open to actionable results is just as important. Ultimately, our analysis indicated if there was significant population of a certain type of mosquito by mid July, then an aggressive spray plan needs to be implemented.
Takeaways
Balance model complexity with feature testing
Importance of taking time to clean and understand data
Build model to be flexible for varying inputs during testing